A bullet column displays horizontal bars that demonstrate the numerical values for a specific summary. With bullet columns, DiveTab users can view the information graphically. By providing visual information, it is easier to analyze the numerical data by comparing it to the other values shown.
Here is an example of a ![]() report page that uses one bullet.
report page that uses one bullet.
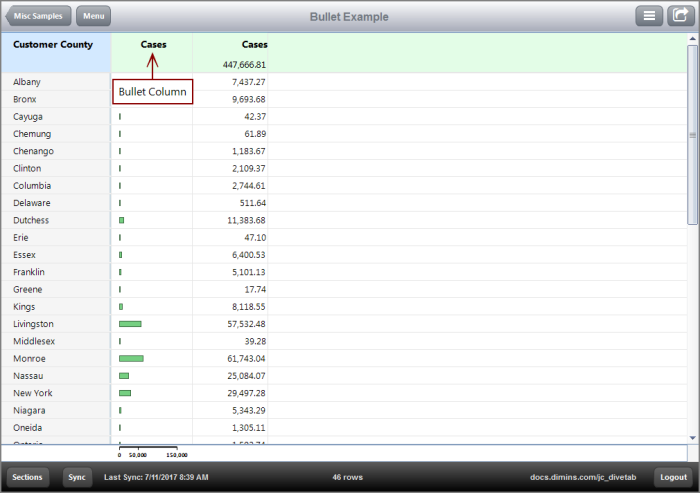
Bullets appear in a separate column and can only be used by tabular pages (report, ad hoc, and cross) and table blocks within central and overview pages.
You can include multiple values within a bullet (showing multiple bars within one row), a threshold value, customize the scale, and change the color of the bullets.
Here is an example of a ![]() report page with two bullets that are more customized.
report page with two bullets that are more customized.
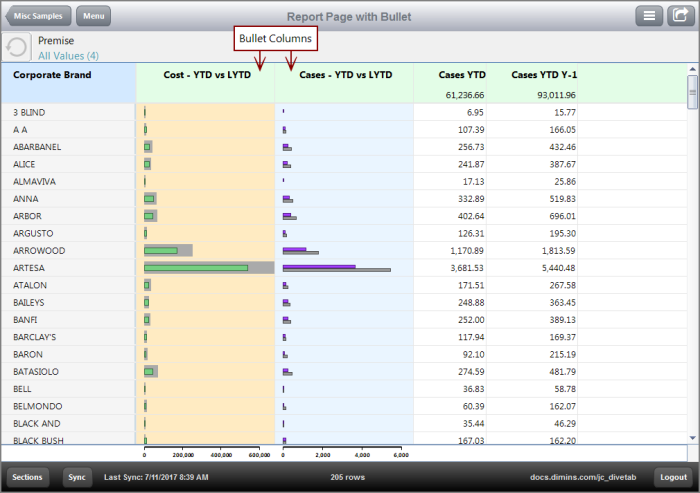
Notice how the column on the left uses thresholds, while the one on the right has a light blue background. The blue background indicates that the values contain links, rather than from a background-color tag.
NOTE: Summary values that are linked appear as a light blue automatically. If a background-color is also in use, the link color takes priority.
You can base a threshold on static numbers or on a column. Use a column when you want to compare information with past trends (for example, past years or time frames).
Here is a ![]() close up view of a bullet column with a background color, threshold, two values, and a scale.
close up view of a bullet column with a background color, threshold, two values, and a scale.
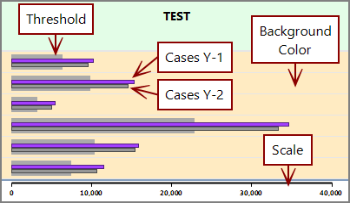
The scale, that by default floats below the column, uses values that are based on the column values. You can customize the scale format and the maximum and minimum values, or you can hide the scale.